Showing posts with label oil price. Show all posts

Platts Five commodity themes to watch closely in 2017  

Posted by Big Gav in ,

Platts has a look at trends to watch in 2017, including oil prices and production levels, the emergence of a global gas market and the rise of electric vehicles and peak oil demand - Five commodity themes to watch closely in 2017.

Against the dramatic political and economic surprises of 2016, S&P Global Platts President Martin Fraenkel lays out his five themes to focus on in commodity markets in 2017. It’s not just oil markets that could provide big shifts in the new year; LNG and electric car markets also deserve attention as commodities markets continue to change.

Michael Klare, The Coming World of "Peak Oil Demand," Not "Peak Oil"  

Posted by Big Gav in , , , , ,

TomDispatch has a new article from Michael Klare on what he calls "The Collapse of the Old Oil Order " - Michael Klare, The Coming World of "Peak Oil Demand," Not "Peak Oil".

Klare views the discord amongst oil producers (evident at the failed talks aimed restraining supply in Doha) as another sign of weak demand for oil in the coming years and a fight between suppliers for market share. He also notes Saudi Arabia is claiming it will raise production from its current 10.2 million barrels per day to 11.5 million barrels and could add another million barrels in the next six to nine months.

At the beginning of this century, many energy analysts were convinced that we were at the edge of the arrival of “peak oil”; a peak, that is, in the output of petroleum in which planetary reserves would be exhausted long before the demand for oil disappeared, triggering a global economic crisis. As a result of advances in drilling technology, however, the supply of oil has continued to grow, while demand has unexpectedly begun to stall. This can be traced both to slowing economic growth globally and to an accelerating “green revolution” in which the planet will be transitioning to non-carbon fuel sources. With most nations now committed to measures aimed at reducing emissions of greenhouse gases under the just-signed Paris climate accord, the demand for oil is likely to experience significant declines in the years ahead. In other words, global oil demand will peak long before supplies begin to run low, creating a monumental challenge for the oil-producing countries.

This is no theoretical construct. It’s reality itself. Net consumption of oil in the advanced industrialized nations has already dropped from 50 million barrels per day in 2005 to 45 million barrels in 2014. Further declines are in store as strict fuel efficiency standards for the production of new vehicles and other climate-related measures take effect, the price of solar and wind power continues to fall, and other alternative energy sources come on line. While the demand for oil does continue to rise in the developing world, even there it’s not climbing at rates previously taken for granted.

Who’s afraid of cheap oil?  

Posted by Big Gav in

The Economist has an article (from January) on the gyrations of the oil price, reviving their circa-2000 prediction of $10 per barrel oil (this doesn't look like occurring and if it did it would be for but a fleeting moment) - Who’s afraid of cheap oil?.

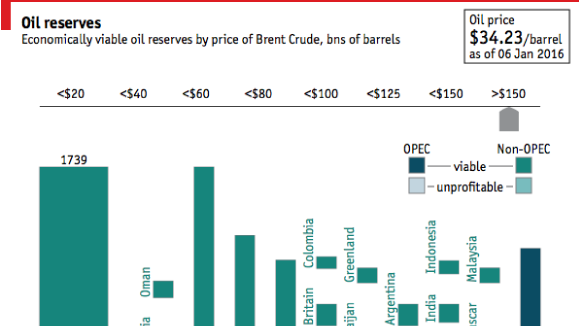
The world is drowning in oil. Saudi Arabia is pumping at almost full tilt. It is widely thought that the Saudis want to drive out higher-cost producers from the industry, including some of the fracking firms that have boosted oil output in the United States from 5m barrels a day (b/d) in 2008 to over 9m b/d now. Saudi Arabia will also be prepared to suffer a lot of pain to thwart Iran, its bitter rival, which this week was poised to rejoin oil markets as nuclear sanctions were lifted, with potential output of 3m-4m b/d.

Despite the Saudis’ efforts, however, producers have proved resilient. Many frackers have eked out efficiencies. They hate the idea of plugging their wells only for the wildcatter on the next block to reap the reward when prices rebound. They will not pack up so long as prices cover day-to-day costs, in some cases as low as $15 a barrel (see article). Meanwhile oil stocks in the mostly rich-country OECD in October stood at 267 days’ net imports, almost 50% higher than five years earlier. They will continue to grow, especially if demand slows by more than expected in China and the rest of Asia. Forecasting the oil price is a mug’s game (as the newspaper that once speculated about $5 oil, we speak from experience), but few expect it to start rising before 2017. Today’s price could mark the bottom of the barrel. Some are predicting a trough of as low as $10.

The Changing Face of World Oil Markets  

Posted by Big Gav in ,

James Hamilton at Econbrowser started one of the year's more interesting peak oil debates back in July with a post on developments in the oil markets - The Changing Face of World Oil Markets.

This year the oil industry celebrated its 155th birthday, continuing a rich history of booms, busts and dramatic technological changes. Many old hands in the oil patch may view recent developments as a continuation of the same old story, wondering if the high prices of the last decade will prove to be another transient cycle with which technological advances will again eventually catch up. But there have been some dramatic changes over the last decade that could mark a major turning point in the history of the world’s use of this key energy source. In this article I review five of the ways in which the world of energy may have changed forever.

1. World oil demand is now driven by the emerging economies. ...
2. Growth in production since 2005 has come from lower-quality hydrocarbons. ...
3. Stagnating world production of crude oil meant significantly higher prices. ...
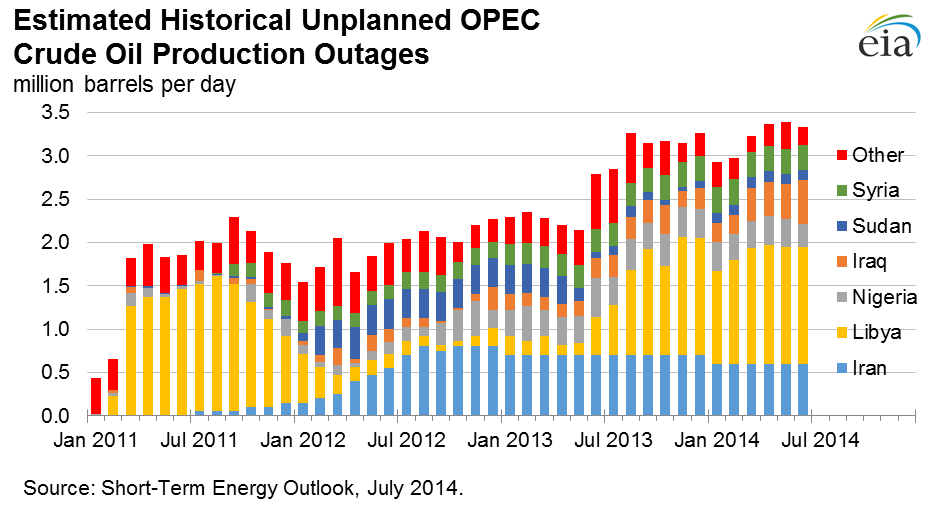
4. Geopolitical disturbances held back growth in oil production. ...
5. Geological limitations are another reason that world oil production stagnated. ...

Although the oil industry has a long history of temporary booms followed by busts, I do not expect the current episode to end as one more chapter in that familiar story. The run-up of oil prices over the last decade resulted from strong growth of demand from emerging economies confronting limited physical potential to increase production from conventional sources. Certainly a change in those fundamentals could shift the equation dramatically. If China were to face a financial crisis, or if peace and stability were suddenly to break out in the Middle East and North Africa, a sharp drop in oil prices would be expected. But even if such events were to occur, the emerging economies would surely subsequently resume their growth, in which case any gains in production from Libya or Iraq would only buy a few more years. If the oil industry does experience another price cycle arising from such developments, any collapse in oil prices would be short-lived.

My conclusion is that hundred-dollar oil is here to stay.

Reuters' John Kemp was moved to respond in disagreement - Kemp: Forecasts For Higher Oil Prices Misjudge The Shale Boom.

The shale revolution will turn out to be only a pause in the upward trend in prices, Hamilton argues, as growing demand from emerging economies and stagnant supplies from conventional oil fields push prices higher in the long term. "Rather than a force pushing oil prices back to historical lows, it seems more accurate to view the emerging tight oil plays as a factor that can mitigate for a while what would otherwise be the tendency for prices to continue to rise."

The problem with Hamilton's analysis is that it largely ignores the impact of the shale revolution on the economics of oil production and understates the tremendous variability in real oil prices in response to changes in technology. The professor devotes just 400 words out of almost 4,000 to discussing the production of crude oil and gas from shale formations.

Most of that discussion focuses on the high cost of drilling and fracturing shale wells; the rapid decline in production; the alleged unprofitability of shale wells; and question of whether the conditions that produced the shale revolution in North American can be replicated in other parts of the world. But this part of the paper is also the weakest, and it highlights the fundamental limitations with Hamilton's entire argument about the increasing difficulty and costs of producing crude oil.

Since 2008, the dramatic increase in oil and gas production from shale formations in North America, and the abundance of shale resources around the world, has discredited theories about peaking oil production. The simple theory that supplies will run out has been reframed as a more sophisticated one about rising prices.

Peak oil supporters now point to the increasing cost of oil production, diminishing energy return on investment and the diminishing energy return on energy invested to claim that it is becoming harder and more expensive to sustain, let alone increase, crude output. Prices must continue to rise in real terms, they say, to reflect the increasing cost of producing crude and to restrain demand. Price increases will prove to be just as disruptive as physically running out of the stuff.

Hamilton's paper lends influential support to this view. He notes that oil demand is now being driven by rising incomes in emerging markets, even as high prices restrain consumption in the advanced economies.

Platts then had a follow up post from Steve Kopits - Guest blog: Hamilton has it right on oil.

Kemp seems to be arguing that shale oil is a game-changer which will materially change the supply outlook and catalyze a fall in oil prices.

To test this assertion, it is worth asking if shale production has actually led to the predicted fall in oil prices. As is well known, the shale surge caused a divergence of the West Texas Intermediate (WTI) oil price, the US domestic standard, from Brent, the international standard. Historically, these two prices rarely diverged by more than a dollar or two. Notwithstanding, from late 2011, surging shale production depressed the WTI price as US supply outran domestic infrastructure capabilities, and government regulations prevented the export of US crude.

Have prices fallen since? Growth of field production in the lower 48 states has been impressive, increasing by 400,000 b/d in the 12 months ending in mid-2011, and rising to a gain of 1 million b/d by mid-2012, a pace it has held ever since.

How did prices react? In the three months ending July 2011, WTI averaged $98, falling to $88/b a year later. On the other hand, by July 2013, WTI was back to $98, and will close this July around $104. Has surging shale production caused the US oil price to collapse? Not all at. It has been accompanied by increasing oil prices, even in the US.

Nor has Brent collapsed. True, Brent averaged $115/b in the three months to July 2011, and fell to $103 just a year later. But it will close this July at about $111/b, not much different from three years ago, and higher than it was at the beginning of the “shale gale.” Shale oil has not led, as a statistical matter, to lower oil prices in the US—or globally—in the last two years.

How can this be, if the oil supply is in such fine fettle? Has peak oil really been debunked? Is Kemp right when he says: “Since 2008, the dramatic increase in oil and gas production from shale formations in North America, and the abundance of shale resources around the world, has discredited theories about peaking oil production.”

As the chart shows, just as many analysts have contended, the oil supply hit an inflection point in 2005. That year signals the high water mark of conventional crude and condensate production, which is 2.1 mbpd less than it was then.

Even if we include refinery processing gain, biofuels and NGLs (these latter two adjusted for energy content equaling about 70% of that of a barrel of crude), we find the oil supply is up only 0.4%, 300,000 b/d, compared to 2005.

Virtually all of the growth—92%, on an energy-adjusted basis—has come from unconventionals, specifically, Canadian oil sands and US shale (tight) oil. Indeed, 70% of the net growth of the global oil supply from 2005 through 2013 came from US shales alone. Shales are not the icing on the cake; they are the cake itself.

This matters, because shale production in turn depends overwhelmingly on only two plays, the Eagle Ford and the Bakken, where production is expected to peak in 2016 or 2017 or see much slower growth in production as the sweet spots there are exhausted. The Permian Basin may pick up the slack, but to date has not done so in needle-moving quantities.

Meanwhile, lagging oil prices are calling into question a number of oil sands projects, particularly those slated to begin production after 2020. Unconventional growth may well be approaching its high water mark. If 1 million b/d growth has led to higher oil prices, what will happen when unconventional growth slows to 300,000 b/d in two or three years?

And there’s more. Kemp states: “North American shale is currently the marginal source of supply in the world oil market, and most producers claim they can break even at $70 or even $60 per barrel.”

It is not clear that the US independents are profitable. An industry can see a boom irrespective of profits or free cash flow if banks and investors are willing to underwrite the promises of future profits. The internet bubble showed us that.

We do not yet know if shale oil and gas will be consistently profitable. We do know, however, that US independents have been massively free cash flow negative in recent years.

D Ray Long has a postscript to the debate - Geology Is Crushing Technology.

In July, I highlighted James Hamilton's paper "The Changing Face of World Oil Markets," as well as the critical response from Reuters writer John Kemp. But I didn't circle back to also highlight Steven Kopits reply to Kemp that appeared in Platts: "Hamilton has it right on oil."

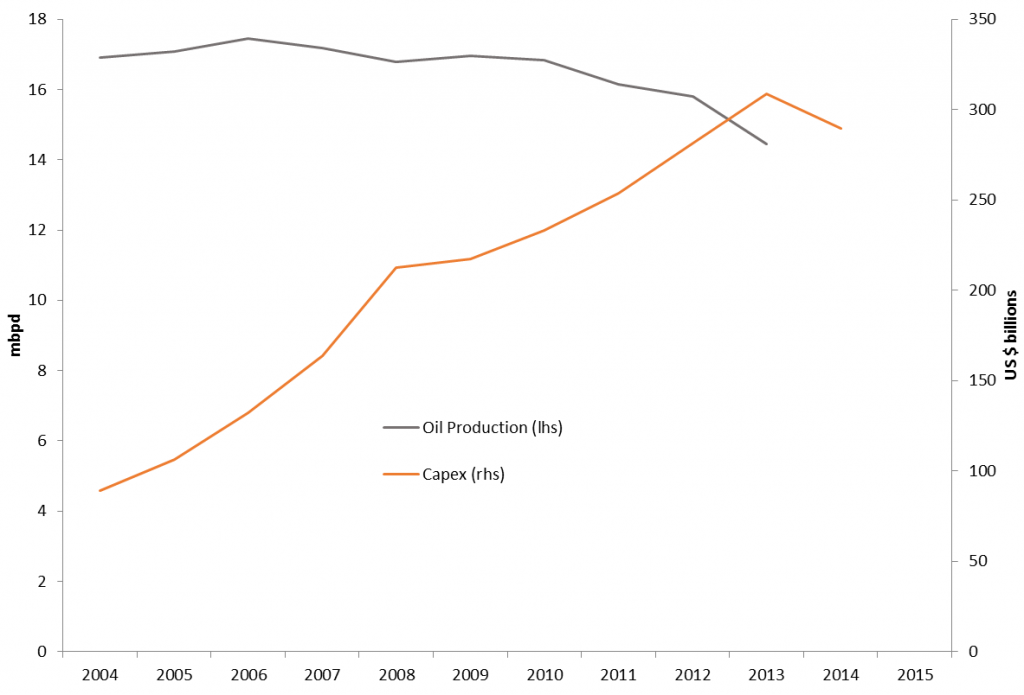
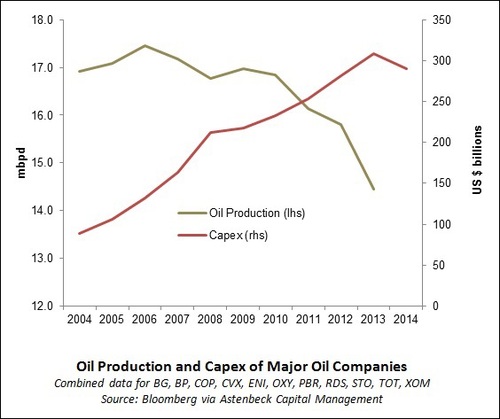
You should definitely read the entire thing, but here's a short quote below on Capex. Kopits discussed the capex issue in great detail in his Columbia University presentation earlier this year (and if you haven't seen that, then go watch it immediately). But the short and simple version: Oil companies are spending more money, while gaining less production. Here's Kopits:

"...productivity of capital has deteriorated by a factor of four, from $5,300 capex b/d of oil production in 2004 to $21,400 in 2013. This deterioration is net of technology improvements. Geology is not only winning, it is crushing technology.

Hamilton’s graph testifies to the grizzly unraveling of the economics underpinning oil production since 2005. For the oil business as a whole, productivity has imploded, not improved."

Peak Oil Trader Who Scored $100 Million Payday Bets Shale Is A Dud  

Posted by Big Gav in , ,

Bloomberg has an article on peak oil trader Andy Hall - Trader Who Scored $100 Million Payday Bets Shale Is Dud.

Andrew John Hall -- known as the God of Crude Oil Trading to some of his peers -- has built his success on a simple creed: Everyone who disagrees with him is wrong.

For most of the past 30 years, that has been a killer strategy. Like a poker player on an endless hot streak, Hall has made billions for the companies for which he’s traded by placing one aggressive bet after another. He was one of the few traders who anticipated both the run-up in and the eventual crash of oil prices in 2008.

Hall was so good that he bagged a $98 million payday in 2008, when he ran Citigroup Inc.’s Phibro LLC trading unit, and was up for about $100 million more in 2009. ...

His wager that oil prices would rise and rise has run headlong into an unanticipated energy revolution -- the frenetic push in the U.S. and elsewhere to wring crude out of shale. Shale drilling has boosted U.S. oil output to the highest level in 27 years; it helped the U.S. supply 84 percent of its energy demand last year. Oil prices, far from taking the upward trajectory Hall predicted, have been essentially unchanged since 2011. ...

“At one point, Phibro traders were the rulers of the world,” says Carl Larry, a former trader who publishes a newsletter on oil markets. “The best always learn how to adapt. Maybe it’s taking him longer to do that now. Or maybe his time has come.”

Hall, based on comments in his letters to investors, is unfazed by the losses and secure in his view that the price of oil is destined to rise. In those letters, he regularly mocks those who are convinced that a shale boom will mean long-term cheap, abundant energy. “When you believe something, facts become inconvenient obstacles,” Hall wrote in April, taking issue with an analyst who predicted a shale renaissance could result in $75-a-barrel oil over the next five years.

Hall is going all in on a bet that the shale-oil boom will play out far sooner than many analysts expect, resulting in a steady increase in prices to as much as $150 a barrel in five years or less.

Investing ever-larger sums of his own money, he’s buying contracts for so-called long-dated oil, to be delivered as far out as 2019, according to interviews with two dozen current and former employees and advisers who are familiar with Hall’s trading but aren’t authorized to speak on the record. To attract buyers, the sellers of these long-dated contracts -- typically shale companies that have financed the boom with mounds of debt -- need to offer them at a discount to existing prices.

Oh no! The oil price could fall  

Posted by Big Gav in ,

While I rarely agree with Ambrose Evans-Pritchard I do appreciate his continual columns on the energy industry and related topics. One recent column of his looked at oil price movements in the near term, predicting that oil prices may fall due to a surge in supply (and moving on to the even less likely conclusion that this will be the trigger for global deflation - surely the economic stimulus caused by cheaper energy would outweigh the loss in income for oil suppliers !) - Coming 'oil glut' may push global economy into deflation.

Personally I think the US shale oil boom will end pretty quickly if oil prices drop much below current levels so there's no chance of any long term "oil glut" depressing prices for any significant period of time. I do agree with his concluding paragraphs at leas...

To avoid confusion, let me be clear that the dangers of dwindling oil supplies in the long-run have not gone away. Easy reserves of crude are being depleted. New fields are more costly. Peak oil may have the last laugh. Yet this should not be confused with the short-term risks of deflationary shock.

I recently attended a Transatlantic Dialogue on Energy Security with senior military officers in London and Washington. The message was that shale will come and go - with US tight gas peaking by 2017 - creating a false sense of security as the deeper strategic threat continues to build. That is broadly my view as well. Much drama can intrude along the way.

Alan Kohler at The BS has a column weakly echoing Evans-Pritchard - Oh no! The oil price could fall.

There is a limit to what Saudi Arabia can do to limit supply. Lewis estimates that it would have to cut output by a quarter to stop the bottom falling out of the market, but Ambrose Evans-Pritchard of The Telegraph says this would push its budget into deep deficit and endanger the welfare subsidies required to keep a lid on tensions in its Eastern Province and the aggrieved Shia minority.

Europe is clearly at the greatest risk of falling into a Japan-style quagmire of long-term deflation and depression, caused by a combination of fiscal austerity and zombie banks.

Last week a report by researchers in Berlin and New York estimated that European banks have a capital shortfall of up to $US1 trillion, with French and German banks in the worst shape. Global bank regulators have let them off the hook to some extent by not increasing the leverage ratio as much as expected, but they still have a long way to go to get their balances sheets back to non-zombie status.

In that context a big drop in the oil price – a reverse oil shock – would not necessarily be a good thing, as you might think.

In theory deflation causes demand to shrink and the value of debt to rise, although in practice during the 19th century prices halved and output increased seven fold. The difference this time is the existence of so much debt and the fact that so many banks are still under-capitalised.

And in addition to Europe, China’s economy has serious problems with debt and falling money supply. Ambrose Evans-Pritchard wrote the other day that “China looks eerily like the US in 2007 when broad money buckled.”

If Chinese demand collapses at the same time as an oil supply glut emerges and United States imports continue to fall, we could find out what deflation in the modern world means in practice, instead of just in theory.

Why Are Petrol Prices Falling?  

Posted by Big Gav in , ,

The Atlantic has a look at the stalling price of petrol in the US - Why Are Gas Prices Falling?.

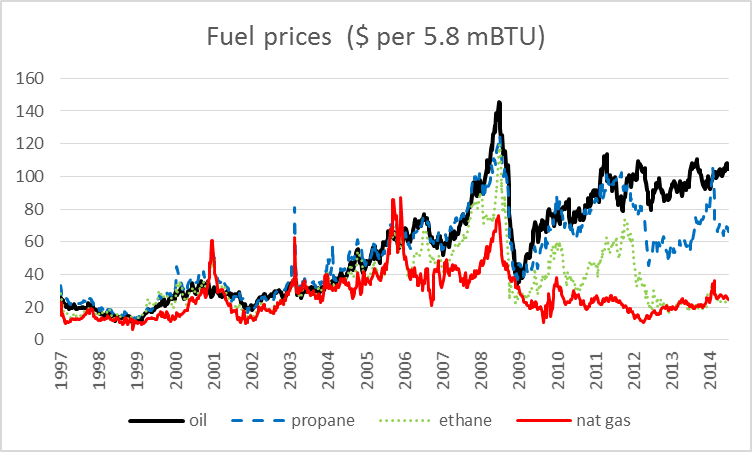
During the big run up in oil and gas prices that you can see in the charts above, some analysts contended that we were up against a geophysical limit on how much oil could be produced. It wasn't that we were running out of oil, but that we wouldn't be able to produce more, even if demand went up.

So far, however, that has not proven to be the case ...

That said, oil is getting harder to find and extract, requiring greater and greater investments of time, money, and energy. That's why, despite the relatively sunny outlook in latest edition of the IEA's World Energy Outlook, the agency cautioned that the "new oil resources" do not "mean the world is on the verge of an era of oil abundance."

US Gas Prices Over $3 For Record 1000 Days  

Posted by Big Gav in ,

NBC reports that US petrol prices have a set a record number of days above $3 a gallon (I always love these archaic imperial measurements that the Americans cling on to) - Gas Over $3 for Record 1000 Days. Just imagine how high they would be if fracking hadn't killed peak oil.

AAA reports the national average for gas prices have been above $3 per gallon for 1,000 consecutive days. It’s the longest gas prices have remained over that threshold and AAA says you should expect it to stay there unless we have another major recession. It's been going on even longer in Washington state -- 1,077 days. “Paying less than $3 per gallon for gasoline may be automotive history for most Americans, like using 8-track tapes or going to a drive-in movie,” AAA President and CEO said.

Although some individual gas stations may have charged $4 or more per gallon during the 1,000-day streak, the national average has never reached that mark. It got close on May 5, 2011, when it reached $3.98 per gallon.

Stuart Staniford On What The Oil Drum Meant  

Posted by Big Gav in , ,

Stuart Staniford at Early Warning has a farewell to The Oil Drum, looking at the evolution of oil supply and price over the past decade - Stuart Staniford On What The Oil Drum Meant.

The popular peak oil blog The Oil Drum (TOD) began in early 2005. I joined as a contributor in mid 2005, later becoming an editor, and I left the site in early 2008. TOD continued in the meantime, at least up until now when the current editors have decided to transition to an archival format. They don't feel the quality and quantity of post submissions justify continuing. They asked a number of us old-timers to comment on the significance of TOD, and these are my reflections.

I start with the chart above. It shows, from 1950-2012, world oil production annually (red curve, left scale), and real oil prices annually (blue curve, right scale). I show in green boxes two regions of major disruption, and between them two regions of relatively calm behavior (in white).

The orderly region from 1950 to 1973 was characterized by very rapid growth in oil production that was achieved at very modest oil prices (around $20/barrel in 2011 dollars).

Then in 1973 came the Arab oil embargo, followed in 1979 by the Iranian revolution and then the Iraq-Iran war. These events caused a series of sharp but relatively short-lived contractions in the global oil supply. The result was huge price increases, and a permanent change in the way the world used oil.

After the dust settled in the mid eighties, oil production resumed growing fairly steadily, but never again at the frenetic pace of before the seventies - from now on society was more concerned with fuel efficiency and grew oil consumption more slowly. Prices fell into the $30 range, and remained there, give or take, for the next couple of decades. This was the second period of stability in the oil markets since WWII.

Then, in late 2004, global oil production largely stopped growing and entered a rough plateau. Prices began to shoot up, reaching well over $100/barrel within a few years, and largely staying there to this day (making allowance for a sharp downward fluctuation during the great recession).

There sprang up a large debate about the meaning of these events. The Oil Drum in particular I believe came to function as a central node in this debate, and one of the best places to hear a range of views that were based on a close analysis of the available data. The reason TOD is now coming to a close is that the need for this particular debate is over, at least for the time being. The data have spoken.

One extreme in this debate was what came to be known as cornucopians, epitomized by Daniel Yergin of the consultancy CERA. He made a long series of predictions that oil production would resume growing and prices would fall any day now. This was most famously satirized in a graph by Glenn Morton:

Obviously, this didn't happen. Oil production has not risen rapidly, and prices have not returned anywhere close to the pre-2004 idea of normal.

Another extreme in the debate were "doomers" who believed that global oil production would begin to fall very rapidly, very soon, because peak oil was upon us. "We're all gonna die" was the logical implication. One such forecaster was TOD contributor Ace who produced a series of forecasts like this one which showed oil production beginning a precipitous decline as of the date of the forecast:

The same piece forecast oil prices to rise rapidly and steadily and pass $200/barrel by the end of 2012. That didn't happen either.

I'm not sure anyone predicted the last eight years perfectly (including me). Still, on the whole, the various "moderates" in the debate came closest. What has actually occurred can best be seen in this graph which shows monthly oil production from a variety of data sources from 2002 onward.

The green curve is the EIA's estimate of the production of "crude and condensate" - C&C - which is a fairly narrow definition of oil that largely measures liquid hydrocarbons that flow out of the ground. The other curves show various estimates of "all liquids", which adds things like biofuels and "natural gas liquids" - compounds like propane and butane removed from natural gas production. These aren't really oil, but can substitute for it to varying degrees and so are often counted with it.

The crude-and-condensate curve is bumpy, but does slope upward slightly. The all liquids curve slopes up more, reflecting the fact that global natural gas production has increased steadily. High oil prices and government policies also induced a biofuel boom after 2005.

Thus we seem to live in a world in which, although traditional sources of oil are declining in many places, high oil prices (around $100-$120) are able to bring out enough low quality sources of hydrocarbon to offset this decline and just a bit more. Examples include oil fracced from very tight rocks in North Dakota, and tar sands production in Canada. These sources are difficult enough to bring on line that prices have not crashed, but are sufficient to prevent global oil production from actually declining. Clearly, we have not passed peak oil yet, and it's not at all clear when we will.

In the meantime, the situation has gotten quite dull. I compile graphs of oil production every month, and it's gotten somewhat akin to watching paint dry; every month, it's pretty much flat, and I tire of saying the same things over and over again.

On the other hand, we certainly don't live in the pre-2004 world any more. Oil prices are high, and there seems little prospect that they will ever fall below $100/barrel for any sustained period. If for no other reason, Saudi Arabia needs an oil price somewhere around there to balance its budget, and they are always in a position to force the price to stay above that threshold by modest decreases in their production.

Rocks for the long run  

Posted by Big Gav in

The Economist has a look at long term commodity price trends - Rocks for the long run.

Long-run rises have been most pronounced for commodities that are “in the ground”, like minerals and natural gas. Energy commodities especially have boomed, soaring by roughly 300% since 1950. Prices of precious metals have also risen, as have industrial ingredients like iron ore. In contrast, prices for resources that can be grown have trended downwards (see chart). The inflation-adjusted prices of rice, corn and wheat are lower now than they were in 1950. Although the global population is 2.8 times above its 1950 level, world grain production is 3.6 times higher.

Oil Price Update  

Posted by Big Gav in

Stuart at Early Warning has an update on oil prices - the rumoured glut of energy hasn't made itself apparent on the charts thus far - Oil Prices.

A while since we've looked at oil prices around here. The chart above shows the two main benchmarks - Brent and WTI - and the spread between them. These days Brent is a better indicator of global oil market conditions, as well as gas prices on the US coasts, while the spread of WTI to Brent is mainly measuring the fact that the boom in tight-oil production in the central US cannot be fully bought to market conveniently yet.

Brent prices have been in and around the $100-$120/barrel band since the beginning of 2011. For the last few months they've been rising and are currently somewhat above the 2011-2013 average. If the supply flatness of 2012 continues, I'd expect them to climb quite a bit more. However, it's not clear to me whether that supply flatness will continue.

Gasoline at Highest Price Ever for This Time of Year  

Posted by Big Gav in

CNBC reports that US petrol prices don't seem to be reflecting all the reports we are hearing about US energy independence being just around the corner - Gasoline at Highest Price Ever for This Time of Year.

U.S. drivers are now paying more to fill up their gas tanks than they ever have at this time of year. The national average price of retail gasoline posted its biggest one-day increase in 23 months on Friday, rising four cents to $3.46 a gallon, according to AAA. The average price has risen 13 cents -- a 4 percent increase -- in the past week.

Gasoline prices have followed in part the climb in the stock and oil prices. Oil and equities have risen sharply over the last few weeks, as the Dow Jones Industrial Average reached 14,000 for the first time since 2007, Brent crude oil futures hit at 4-month high near $117 a barrel, while the U.S. oi lprice is near $98 a barrel.

Retail gasoline prices have also hit a new milestone. "This is the highest price record for February 1st," says OPIS analyst Tom Kloza, who predicts the national average price of regular gasoline will climb a few more pennies to $3.50 a gallon this weekend.

Oil Espionage: Traders Spy on Oklahoma Hub With Satellites, Sensors and Infrared Cameras  

Posted by Big Gav in

NPR has a look at the lengths people will go to understand oil supply dynamics at Cushing, Oklahoma (which drive the WTI price) - Oil Espionage: Traders Spy on Oklahoma Hub With Satellites, Sensors and Infrared Cameras.

The bottleneck of crude stored in Cushing, Okla., has become the country’s “biggest bank vault of oil,” Businessweek’s Matthew Phillips writes. And it’s only getting bigger.

The clog — which is pushing down the price of West Texas Intermediate crude from Oklahoma, creating a gap with its international rival, Brent — is making traders rich.

Information is everything, and traders are using high-tech extremes to extract data about oil storage and flow from the high-security oil hub. Photographers in helicopters? That’s relatively low-level when it comes to these storage tank spy games, Businessweek reports:

Recently, photographers have started using infrared cameras to peer inside the tanks. The difference in heat can often show where the oil line is.
Aerial photography is common. A bird’s-eye view allows analysts to estimate storage levels by calculating the angle of shadows cast by massive tanks’ floating roofs.

And that’s just the beginning.

A private “energy intelligence” company called Genscape is funding much of the high-tech surveillance, reports Businessweek, whose parent company — Bloomberg — also does their own Cushing surveillance by way of twice-weekly satellite flyovers.

How High Oil Prices Will Permanently Cap Economic Growth  

Posted by Big Gav in ,

Bloomberg has an article by Jeff Rubin arguing that high oil prices cap economic growth ("permanently" - though I'd argue its really until we reconfigure our economies to be based on renewable energy) - How High Oil Prices Will Permanently Cap Economic Growth.

For most of the last century, cheap oil powered global economic growth. But in the last decade, the price of oil has quadrupled, and that shift will permanently shackle the growth potential of the world’s economies.

The countries guzzling the most oil are taking the biggest hits to potential economic growth. That’s sobering news for the U.S., which consumes almost a fifth of the oil used in the world every day. Not long ago, when oil was $20 a barrel, the U.S. was the locomotive of global economic growth; the federal government was running budget surpluses; the jobless rate at the beginning of the last decade was at a 40-year low. Now, growth is stalled, the deficit is more than $1 trillion and almost 13 million Americans are unemployed.

And the U.S. isn’t the only country getting squeezed. From Europe to Japan, governments are struggling to restore growth. But the economic remedies being used are doing more harm than good, based as they are on a fundamental belief that economic growth can return to its former strength. Central bankers and policy makers have failed to fully recognize the suffocating impact of $100-a-barrel oil.

Running huge budget deficits and keeping borrowing costs at record lows are only compounding current problems. These policies cannot be long-term substitutes for cheap oil because an economy can’t grow if it can no longer afford to burn the fuel on which it runs. The end of growth means governments will need to radically change how economies are managed. Fiscal and monetary policies need to be recalibrated to account for slower potential growth rates.

The Pricing of Crude Oil  

Posted by Big Gav in

The Reserve Bank has an interesting analysis of how crude oil is priced in world markets - The Pricing of Crude Oil.

Arguably no commodity is more important for the modern economy than oil. This is true in terms of both production and financial market activity. Yet its pricing is relatively complex. In part this reflects the fact that there are actually more than 300 types of crude oil, the characteristics of which can vary quite markedly. This article describes some of the key features of the oil market and then discusses the pricing of oil, highlighting the important role of the futures market. It also notes some related issues for the oil market. ...

The crude oil market is significantly larger than that for any other commodity, both in terms of physical production and financial market activity (Table 1).

The value of crude oil production is more than twice that of coal and natural gas, 10 times that of iron ore and almost 20 times that of copper. Crude oil is the most widely used source of fuel, supplying around one-third of the world’s energy needs. It is also used to produce a variety of other products including plastics, synthetic fibres and bitumen. Accordingly, changes in the price of crude oil have far-reaching effects.

The pricing mechanism underlying crude oil is, however, not as straightforward as it might appear. Almost all crude oil sold internationally is traded in the ‘over-the-counter’ (OTC) market, where the transaction details are not readily observable. Instead, private sector firms known as price reporting agencies (PRAs) play a central role in establishing and reporting the price of oil – the two most significant PRAs being Platts and Argus Media. ...

While physical crude oil can be purchased from organised exchanges by entering into a futures contract, only around 1 per cent of these contracts are in fact settled in terms of the physical commodity. Futures contracts are standardised contracts traded on organised exchanges, specifying a set quantity (usually 1 000 barrels) of a set type of crude oil for future delivery. The two key oil futures contracts are the New York Mercantile Exchange (NYMEX) WTI light sweet crude and the Intercontinental Exchange (ICE) Brent contracts. ...

With so many different grades of oil, there is actually no specific individual market price for most crude oils. Instead, prices are determined with reference to a few benchmark oil prices, notably Brent and West Texas Intermediate (WTI) (Graph  3). Brent is produced in the North Sea and is used as a reference price for roughly two-thirds of the global physical trade in oil, although it only accounts for around 1 per cent of world crude oil production (Table 3). WTI is produced in the United States and has traditionally dominated the futures market, accounting for around two-thirds of futures trading activity. However, futures market trading in Brent has increased significantly in recent years to be now close to that for WTI, reinforcing Brent’s role as the key global benchmark (Graph 4). As discussed below, Brent’s dominance as a benchmark has benefited from the fact that it is a seaborne crude and, unlike WTI (which is a landlocked pipeline crude), can readily be shipped around the world.

These benchmarks form the basis for the pricing of most contracts used to trade oil in the physical (and financial futures) markets. For oil transactions undertaken in the spot market, or negotiated via term contracts between buyers and sellers, contracts specify the pricing mechanism that will be used to calculate the price of the shipment. So-called ‘formula’ pricing is the most common mechanism, and it anchors the price of a contracted cargo to a benchmark price, with various price differentials then added or subtracted. These price differentials relate to factors such as the difference in quality between the contracted and benchmark crude oils, transportation costs and the difference in the refinery’s return from refining the contracted and benchmark crudes into the various petroleum products. For example, a barrel of Brent is generally worth more than a barrel of Dubai (a  medium sour crude oil) because Brent will yield more high-value gasoline, diesel and jet fuel than Dubai without the need for intensive refining. However, the actual magnitude of the Brent-Dubai spread will depend on the relative prices of these petroleum products at the time when the oil is sold to the refineries, along with the location and the spare capacity in those refineries that can easily convert lower-quality crude oil into higher-yielding petroleum products. Reflecting changes in these fundamental determinants, the Brent-Dubai spread has fluctuated within a range of around US$0–15 per barrel. These benchmark prices used in formula pricing are usually based on either (i) ‘spot’ prices determined by PRAs (for example, a ‘spot’ price published by Platts called Dated Brent); or (ii) prices determined in futures markets (for example, the assessed WTI price published by the PRAs).

Oil companies often reference more than one benchmark price depending on the final destination; for example, Saudi Aramco typically employs the Brent benchmark to price oil exports to Europe, Dubai-Oman for exports to Asia and the Argus Sour Crude Index for exports to the United States. These particular crudes emerged as benchmarks due to several distinctive characteristics. Brent developed as a benchmark owing to favourable tax regulations for oil producers in the United Kingdom, in addition to the benefits of stable legal and political institutions (Fattouh 2011). Ownership of Brent crude oil is well diversified, with more than 15 different companies producing it, which helps to reduce individual producers’ pricing power.

Brent can also be used by a variety of buyers, given that it is a light sweet crude oil that requires relatively little processing. The physical infrastructure underlying Brent is also well developed. When the Brent benchmark was established in the mid 1980s, its production was initially reasonably large and stable, which is an important characteristic of a benchmark as it guarantees timely and reliable delivery. Although the volume of Brent crude oil produced has declined over time, three other North Sea crudes have been added to the Brent benchmark basket over the past decade, such that it now comprises Brent, Forties, Oseberg and Ekofisk (BFOE; Graph  5). The combination of these four alternatively deliverable grades has allowed the Brent benchmark to retain a reasonable volume of production. And while there are concerns about the adequacy of production volumes in the future, the depth and liquidity of the Brent futures market has nevertheless increased noticeably in recent years.

If alternative crude oils cannot be delivered against a benchmark, declining production volumes can weaken the status of that crude oil as a benchmark. This is because it becomes a less accurate barometer of current supply and demand as it becomes traded less frequently, and lower traded volumes enable individual market participants to influence the price more easily. Malaysian Tapis – which was previously a key benchmark for the Asia-Pacific region – is a case in point. Tapis’s benchmark status has faded away in recent years owing to declining production volumes; recently, only a single cargo of Tapis has typically been available for export each month, down from around 8 cargoes per month in previous years.

This compares with around 45 cargoes per month currently for the Brent benchmark. Declining production volumes, coupled with the absence of any alternative similar crude oils produced in the region, have seen refiners and producers shift to benchmark against other prices, predominantly Brent.

The emergence of WTI as a benchmark was also assisted by the presence of secure legal and regulatory regimes in the United States. WTI was established as a benchmark in 1983 and its status increased in prominence as the depth and liquidity of its futures contract expanded. Like Brent, WTI is a light sweet crude that is available from a broad range of producers. Similarly, several different types of crude can be delivered against the WTI contract, including sweet crudes from Oklahoma, New Mexico and Texas, as well as several foreign crude oils. WTI crudes are delivered via an extensive pipeline system (as well as by rail) to Cushing, Oklahoma.

Recently, however, the system has struggled to cope with the increasing volumes of crude oil flowing through Cushing. This has resulted in persistent inventory bottlenecks, owing to Cushing’s limited storage capacity and its landlocked location. These bottlenecks have weighed on the WTI price in recent years, to the point where it is now significantly influenced by local supply and demand conditions, in addition to those for the world as a whole (as indicated by the divergence between WTI and Brent oil prices shown in Graph 3). This has weakened WTI’s status as a global benchmark. ...

Given that oil prices are essentially jointly determined in both the physical and financial markets, it is no easy task to disentangle the effect of each market in the price discovery process with any precision. Nevertheless, futures markets appear to play an important role in the pricing of oil, perhaps more so than for other commodities. Indeed, there is a view that crude oil price levels are essentially determined in the futures market.

This is clearest for WTI where PRAs identify the ‘physical’ price directly from the deep and liquid futures market, and where there is no significant parallel OTC market. It is less obvious, however, for Brent. While Brent forward prices are typically used by the PRAs to derive the Dated Brent price, as noted above Brent forward and futures markets are directly linked via EFPs. Many large oil market players reportedly hold Brent forwards and futures in their portfolios, arbitraging between the two instruments, such that the prices of Brent futures and forwards typically converge.

The complexity of the oil pricing arrangements makes it difficult to demonstrate convincingly that benchmark oil prices fully reflect physical supply and demand conditions rather than the actions of uninformed financial speculators. Nevertheless, movements over time in the price differentials for the various benchmark crudes are broadly consistent with changes in demand and supply. The Brent-WTI spread provides a good example of the influence of such factors on oil price differentials (Graph 6). Prior to 2011, Brent and WTI prices generally moved in tandem, with the spread largely reflecting the costs of transporting Brent-referenced crude oils to the United States. In recent years, however, increased volumes of crude oil from North Dakota and Canada have flowed into Cushing, leading to a build-up in inventories. Most pipelines flow from the rest of North America into Cushing, making it difficult to move the extra crude oil out of Cushing. This has led to persistent inventory bottlenecks, which have weighed heavily on the price of WTI over the past 18 months, leading the Brent-WTI spread to widen to US$10–30 per barrel.

The recent widening of the Brent-WTI spread is also likely to reflect concerns about declining production volumes in the North Sea. More transparent information about oil reserves, daily production volumes and demand-driven factors could assist more efficient pricing in the oil market. Information about the demand for oil is often not known until well after the period for which it is reported. On the supply side, there is ongoing concern regarding the accuracy of various countries’ reported production volumes, while oil reserve estimates are subjective and depend on partial information and project feasibility. There have been steps towards greater transparency in the oil market; for example, the Joint Organisations Data Initiative (JODI) was established in 2001 to provide accurate and timely crude oil data on production, consumption, trade, refining and inventories. Nonetheless, there is still scope to increase country coverage and data quality

Yemen’s multiple proxy wars a recipe for a famine  

Posted by Big Gav in , ,

Crikey has a look at the famine in Yemen, exacerbated by high prices for diesel - Yemen’s multiple proxy wars a recipe for a famine.

For decades throughout the 20th century, the idea of famine had two dominant uses in the West.

The first was proof of the Christian ideal that “the poor you will always have with you”, thus re-affirming the eternal need for charity, and the limited usefulness of political struggle — the second was to reaffirm a vaguely or explicitly racialist and Malthusian notion that the dusky-skinned two thirds of the world really couldn’t manage themselves that well, and were doomed to over-breeding and starvation. Before the Second World War, China was the locus for this concern/panic — in various famines until the 1949 revolution, children would be exchanged between families to be eaten, or sold in the marketplace.

After the war, attention switched to India, and then in the 1970s and ’80s, to Ethiopia and the rest of Africa. The story was static, and endlessly repeated — skeletal children, milk powder, guilt, appeals, etc. The global extravaganza of Live Aid in 1985 was probably the acme of this well-meant but bone-headed view of starvation — appropriately enough celebrated by a song in which a phalanx of stars wondered if animist and Muslim peoples even knew it was Christmas time at all.

But by this time another view of famine was beginning to permeate the liberal West, with the 1981 publication of Amartya Sen’s Poverty and Famines, which deployed an array of theories to argue that famines almost always occurred in regions where there was plenty of food — and that even when there was a will to alleviate the famine, the absence of democratic and open political structures made such alleviation impossible.

Sen’s example was the Bengal Famine of 1943 — something that Commonwealth readers rarely hear of in tales of WW2, because 3 million Indians died due to the incompetence, indecision and outright racism of the British authorities. Sen’s argument made an impact where more radical left-wing accounts of the political nature of famine had been dismissed — but many were still unwilling to concede one of his core points, that one of the great barriers to alleviating famine was the market itself.

Sen’s argument has made it impossible for Western news to report famine in the way it once did, but it’s a close run thing. Fragments of reasons a region might suddenly descend into desperate starvation are aired, but there remains a basic inability to tell a connected story. The default position remains the Pieta, the starving child in arms.

Which brings us to the Yemen famine, which has suddenly hit the headlines, after bubbling in the background of the news for months. Ten million people — nearly half of the country’s population — are at risk of starvation, yet the food shortage is not affecting whole regions or areas equally. The burden is falling overwhelmingly on the poor, with people starving while nearby markets are full.

Though there’s been a persistent food shortage since the global food price rise in 2008 — and in fact food has always been short for the poor in the country — the situation has been made urgent by several coincident factors. A drought has persisted for more than three years, and is at its worst this summer, leading to a lack of work for millions of rural labourers. It’s also Ramadan, which, perversely, as a month of daylight fasting, raises food prices — since the fasting is followed by night-time feasting.

Added to these woes, Yemen is starving because it has become a site for multiple proxy wars — the Shia-based Sadah uprising from the north-west, a South Yemen uprising (based around the territory of the old Soviet-era Marxist state), and the Arab Spring general insurgency against the 30-plus-year reign of President Salleh, and last but not least a proxy war between al-Qaeda and US drone attacks.

The result is a country in which substantial networks not merely of trade, but also of inter-family support and charity have broken down, making the usual transfer between rich and poor all the more difficult, such as it occurs. To be fair, it has also been pointed out that the production of the intoxicant herb “khat” dominates agricultural production without providing any nourishment (though it also acts as an appetite suppressant), to the detriment of food production and household budgets.

But above all and beyond all this is the way in which Yemen is trapped in a global commodity system, with steadily rising prices for basic staple foods (of which Yemen imports 90%), and for diesel oil, which is used to pump water. At this point, with diesel oil unaffordable, many families are reliant on charity for a continued supply of water.

This crippling gap has led Oxfam to approach the problem in a simple way — they’re simply giving money to the poor, so that they can shop at market, and also acquire diesel. But the inevitable result of that will be a further bump in prices as the money swims into the system without expanded production, and the cycle begins again.

The Yemen famine then, is something we will begin to see more and more — a situation in which a poor and precarious country has its price signals swamped by global demand and remorselessly rising prices. With several decades of rising crop yields and low oil prices, now curtailed, it will be the nations who have not managed to get on the development ladder — or the poor parts of those who have — that will pay for the prosperity being enjoyed by a booming global urban and industrial class. In that case, the price signal becomes not a carrier of information, but a barrier to it, a la Sen — it tells us nothing about what is really required to be done, within any ethical system worthy of the name.

That story won’t be told in even the most searching reports on this famine, or the next, in the next place. We have come a long way from famine as an act of God, but we are not yet ready to recognise it as a product of global markets, or our role within it.

Marginal Oil Production Cost Nearing $92 Per Barrel  

Posted by Big Gav in ,

Future Pundit points to a Bernstein Research paper describing the marginal cost of oil production - Marginal Oil Production Cost Nearing $92 Per Barrel.

Energy analysts at Bernstein say the marginal cost of oil production, already $92 per barrel, is nearing $100 per barrel.
The marginal cost of the 50 largest oil and gas producers globally increased to US$92/bbl in 2011, an increase of 11% y-o-y and in-line with historical average CAGR growth. Assuming another double digit increase this year, marginal costs for the 50 largest oil and gas producers could reach close to US$100/bbl.
Their analysis does not include OPEC or former Soviet Union producers. But this does not matter. Since the former SU and OPEC aren't going to grow their production fast enough to meet rising world demand the marginal cost of the other producers will determine at what price rising demand and market price will meet.

This rapidly rising marginal cost of production is what Peak Oil looks like. Peak Oil is going to happen because marginal cost will go too high for the world economy to afford to pay what it takes to boost production. At that point oil production will start falling. I originally expected peak production to happen at a much higher price for oil. But the European debt crisis, the deceleration of Chinese economic growth, and the continued weak US economic recovery make me think peak global oil production will happen at a price not much higher than current oil prices.

The costs of tight shale oil is very high and high oil prices are needed to keep it flowing.

"The United States is producing an awful amount of oil from tight shale and tight sands reservoirs... If oil prices send a signal and drop below the $90-$80 level it is going to be uneconomic to drill those well. So drilling will stop immediately," said Michel Hulme, fund manager at Lombard Odier.
How high an oil price is needed to start world oil demand headed on a downward slope? Higher or lower than the current price range near $90-100?

Has The World Reached Economic Peak Oil ?  

Posted by Big Gav in ,

The peak oil world seems to have (thankfully) mostly moved from viewing the defining aspect of the peak of oil production as a function of oil in the ground to being a function of the price it takes to produce new oil - David Strahan has a good example of this at his blog - HAS THE WORLD REACHED ECONOMIC PEAK OIL? .

Whisper it. Oil production in the US is increasing. The country where output peaked in 1970 and then shrank by 40 per cent over four decades, has turned some kind of corner. Between 2008 and 2010, production rebounded by 800,000 barrels per day to 7.5 million barrels per day, and analysts forecast more growth to come. Goldman Sachs predicts that by 2017 production in the US could reach almost 11 mb/d, just shy of its all-time high, restoring the country to its former glory as the world’s biggest producer. ...

Indeed, if the world is suddenly awash with oil, somebody forgot to tell the oil market. Oil remains stubbornly above $100 per barrel of Brent crude, the main international benchmark. Most analysts agree this is because supply is struggling to keep pace with demand, despite weakening western economies. But if all this extra oil is coming on-stream, how come?

Part of the reason is down to short-term unforeseen disruptions, such as the Deepwater Horizon disaster in theGulf of Mexico last year which delayed many drilling projects, and the Libyan revolution which cut global supply by almost 1.6 mb/d. The impact of these events should fade in time but there are clearly deeper forces at work. Producing oil is getting harder.

Not that it was ever easy. The amount of oil produced by existing fields is always in decline because as oil is extracted, pressure in the reservoir falls and the oil comes out more slowly. As a result, every year the industry must drill new wells capable of supplying around 3 mb/d – or 30 per cent of Saudi Arabia’s production – just to stand still. Satisfying the growth in global demand, at least when the economy is expanding, requires roughly another 1.5 mb/d annually.

Filling these holes gets more difficult as the “easy oil” gets scarcer. Companies are now exploring to the ends of the earth – from the Falklands to the Arctic– and are drilling reservoirs that are deeper, hotter and higher pressure than ever, all of which raise new engineering challenges. That has pushed costs up massively, with effects that have yet to be widely understood.

Offshore, companies are working at ever greater depths. During the 1980s and 1990s, for instance, Petrobras, Brazil’s state oil company, made most of its offshore discoveries beneath about 3 kilometres of sea and rock. In 2007, it found the Lula field, about 7 km down. Drilling Lula needed 4 km more specialist steel pipe at a time when steel prices were soaring because of higher energy costs.

Even onshore, costs are rising. Shale-oil fracking wells typically run horizontally and need four times as much steel as a vertical well. According to analysts at JPMorgan, such inflation is rampant throughout the industry. Exxon’s production investments, for instance, soared from $15 billion per quarter in the 1990s to more than $100 billion in the second quarter of 2008 – while the amount of oil and gas it produced scarcely changed.

Some of the most costly oil comes from the tar sands of Canada, with its vast open-cast mines and energy-intensive production processes. According to investment bank Barclays Capital, new projects here need to earn as much as $90 a barrel just to break even. Saudi Arabia, the only country with meaningful spare production capacity, could have produced oil more cheaply a few years ago, but not now. It has increased public spending following the Arab Spring, and now needs $95 per barrel to balance its budget. These pressures, says Paul Horsnell, director of commodities research at Barclays, mean that oil prices are unlikely to fall below these levels unless the economy collapses. He forecasts $137 per barrel in 2015, and $185 in 2020.

So if there is lots of oil down there but it is much more costly to produce, can we have as much as we want if we are prepared to pay for it? Well, that depends on what you judge to be enough and who you mean by “we”, says Steven Kopits, US managing director of energy consultants Douglas Westwood.

The trouble is, high oil prices don’t just encourage oil companies to innovate, they also damage national economies – although some countries are more resilient than others. A penetrating analysis by Kopits found that historically theUSgoes into recession whenever it spends more than about 4.5 per cent of its GDP on oil. Today, that would equate to $90 a barrel. That level also holds for others in the OECD club of wealthy nations, says Kopits. But the evidence suggests thatChinais willing to pay more; it only cuts back on oil purchases when they account for more than 6 per cent of its GDP, equivalent to about $110 per barrel.

The disparity, says Kopits, arises because Chinese society assigns more value to a barrel of oil. Gaining a barrel can transform the lives of Chinese people – allowing them to travel by car for the first time, for example. In the west, losing a barrel merely means trading in a gas-guzzler for a more fuel efficient model.

But oil is so useful that nobody cuts back voluntarily, meaning prices must rise to excruciating levels to force rich western consumers to economise. The first “peak oil recession” started in 2009, says Kopits. It took oil at $147 a barrel and the deepest recession since the 1930s to prise oil from the grip of consumers in OECD countries. Since early 2008, OECD oil consumption has fallen by 4 mb/d, while non-OECD consumption – mainly inChina– has gained 6 mb/d. Global oil production rose 2 mb/d during that period, so developing countries have consumed all the additional supply plus that given up by industrialised economies. “China is bidding away the OECD oil supply,” says Kopits, “and recessions are the mechanism by which that oil is being transferred from weaker economies to faster growing economies.”

With China embarking on rapid “motorisation” – car sales in China leapfrogged those in the US in 2010 – the outlook is for repeated oil price spikes and recessions. We appear now to be entering the second peak oil recession, says Kopits, and others will follow. For the time being this is a problem for the west, but prices could rise to levels that are unsupportable even for China. On this view, peak oil is as much an economic construct as a geological one.

Analysts at Deutsche Bank are more optimistic, and predict that a final oil price spike to $175 in 2015 will lead to rapid electrification of transport and relieve pressure on the oil supply. But Kopits is doubtful that we can escape so easily. “Buckle up,” he concludes, “we’re in for a bumpy ride.”

Blodget: It's Time To Start Freaking Out About Oil Prices  

Posted by Big Gav in ,

The Business Insider has a column by Henry Blodget worrying about now perpetually high oil prices- It's Time To Start Freaking Out About Oil Prices.

There have been so many other temporary emergencies in the world over the past few years that it's easy to overlook a permanent one:

Oil prices.

Right now, much of the global economy is weak... and oil is still over $100 a barrel! A few years ago, when oil prices first hit this level, the news came as an absolute shock. And soon, when gas hit $4 a gallon, the entire national conversation changed.

(It didn't change so much internationally, because, thanks to gas taxes, other countries already charge way more than $4 a gallon for gas, so oil price moves don't have so huge and visible an impact on driving costs).

Specifically, $100+ oil caused many Americans to buy different cars and drive less. And it put a choke chain on the economy, throttling growth. And, shortly thereafter, the economy tanked. And then, of course, oil prices followed the economy down, allowing everyone to focus on other more pressing emergencies.

But then, with even a crappy economic recovery from the depths of the financial crisis, oil prices soared again. And now they're back to near-emergency levels, even with the global economy sputtering. ...

Yes, if the global economy goes back into recession, oil prices will drop again. But the drop will be temporary. And if the economy ever threatens to start growing at its full potential, meanwhile, oil prices will likely keep right on going up. Until they choke off growth again.

And so on.

It has gotten to the point, in fact, that oil prices may start to act as a natural Central Bank on the world economy--raising costs when the economy starts to heat up and cutting them when it cools. And that would be fine...if we could maintain reasonable oil prices when the economy was running at a healthy rate.

But the economy is not running at a healthy rate right now, at least not in Europe and the United States. And oil prices are already over $100 a barrel.

So we hate to think what will happen if and when we finally do see a vigorous economic recovery.

McKinsey Quarterly has a look at ways companies can prepare for an era of high oil prices - Another oil shock? (free subscription required to read the whole article).
It’s been a while since the world has been truly preoccupied with the threat of sustained high oil prices. The global economic recovery has been muted, and a double-dip recession remains possible.

But that dour prospect shouldn’t make executives sanguine about the risk of another oil shock. Emerging markets are still in the midst of a historic transition toward greater energy consumption. When global economic performance becomes more robust, oil demand is likely to grow faster than supply capacity can. As that happens, at some point before too long supply and demand could collide—gently or ferociously.

The case for the benign scenario rests on a steady evolution away from oil consumption in areas such as transportation, chemical production, power, and home heating. Moves by many major economies to impose tougher automotive fuel efficiency standards are a step in this direction.

However, fully achieving the needed transition will take more stringent regulation, such as the abolition of fuel subsidies in oil-producing countries, Asia, and elsewhere, as well as widespread consumer behavior changes. And historically, governments, companies, and consumers have been disinclined to tackle tough policy choices or make big changes until their backs are against the wall.

This inertia suggests another scenario—one that’s sufficiently plausible and underappreciated that we think it’s worth exploring: the prospect that within this decade, the world could experience a period of significant volatility, with oil prices leaping upward and oscillating between $125 and $175 a barrel (or higher) for some time. The resulting economic pain would be significant.

Economic modeling by our colleagues suggests that by 2020, global GDP would be about $1.5 trillion smaller than expected, if oil prices spiked and stayed high for several years.

But like any difficult transition, this one also would create major opportunities—for consumers of energy to differentiate their cost structures from competitors that aren’t prepared and for a host of energy innovators to create substitutes for oil and tap into new sources of supply.

Furthermore, if we endured a period of high and volatile prices that lasted for two or three years, by 2020 or so oil could face real competition from other energy sources.

The UK Daily Telegraph is quoting BP chief Bob Dudley talking about the risk high oil prices pose to economic recovery in the US - Bob Dudley says high oil prices threaten economic recovery
.
Mr Dudley said that US consumers were on track to spend $200bn more on oil in 2011 than they had done last year, due to the higher crude prices. He said that US consumers would be the first to feel the effects of rising crude prices because fuel taxes in the country were so low, leaving only limited potential to lower prices at the pumps through tax cuts.

Oil prices were pushed up at the start of 2011 by instability resulting from the Arab Spring and have remained above $100 for most of this year.

Strong demand from Asian countries, which Mr Dudley said was "holding up", has helped to keep the prices high, despite the eurozone crisis threatening economic slowdown.

However, if oil prices did negatively affect the US economy, the impact would reverberate globally, he warned. "A downturn in the US affects goods and services from China, India and indeed this region [the Middle East], particularly if energy demand is affected."

Mr Dudley said that the energy industry needed to add the equivalent of one large oil producer like Saudi Arabia every five years if it were to offset the decline in output from existing fields.

US petrol is artificially cheap  

Posted by Big Gav in

Grist has a look at the unreasonably low price of petrol in the US - U.S. gas is artificially cheap: What we don’t pay for at the pump.

What's the true price of gasoline? This animated feature from the Center for Investigative Reporting explores the "external costs" of gasoline use in the U.S. -- including pollution and the health problems caused by it. ...

California has some of the dirtiest air in the nation. Consequently, it has some of the strictest rules for gasoline, meaning it burns cleaner than it does in many other states. But cleaner fuels are more expensive.

Clean air requirements, combined with supply and refining constraints, make the price of California gas consistently among the highest in the nation. Turmoil in the Middle East is another factor that pushes up the global price of crude oil. Even though the average price for a gallon of regular unleaded gas in California fluctuates around $4, some experts argue that $4 a gallon is much less than the real cost.

Compared with other industrialized countries, the U.S. has it cheap. The Economist notes that American consumers pay about half of what Europeans pay, which is up to about $8.50 per gallon (or $2.25 per liter). The media website Good has a nifty chart showing the disparity in prices across the Atlantic, and PBS' NewsHour explains the effect Middle East turmoil has on the retail price of gas. While politicians on both sides of the aisle bicker about why gas is expensive, Sen. Jeff Bingaman, (D-N.M.), is one who explains the real reasons, and as David Roberts notes, he is lonely in doing so.

Even though reducing toxic chemicals in gasoline might make it more expensive, the EPA argues that clean air provides long-term cost benefits. A recent study of the Clean Air Act showed "the public health and environmental benefits ... exceed their costs by a margin of four to one."

From 1990 to 2010, these regulations have prevented "23,000 Americans from dying prematurely, [and] averted over 1,700,000 incidences of asthma attacks and aggravation of chronic asthma." In the same two decades, it also prevented more than 4.1 million lost workdays due to pollution-related illnesses.


Statistics

Locations of visitors to this page

blogspot visitor
Stat Counter

Total Pageviews

Ads

Books

Followers

Blog Archive

Labels

australia (619) global warming (423) solar power (397) peak oil (355) renewable energy (302) electric vehicles (250) wind power (194) ocean energy (165) csp (159) solar thermal power (145) geothermal energy (144) energy storage (142) smart grids (140) oil (139) solar pv (138) tidal power (137) coal seam gas (131) nuclear power (129) china (120) lng (117) iraq (113) geothermal power (112) green buildings (110) natural gas (110) agriculture (91) oil price (80) biofuel (78) wave power (73) smart meters (72) coal (70) uk (69) electricity grid (67) energy efficiency (64) google (58) internet (50) surveillance (50) bicycle (49) big brother (49) shale gas (49) food prices (48) tesla (46) thin film solar (42) biomimicry (40) canada (40) scotland (38) ocean power (37) politics (37) shale oil (37) new zealand (35) air transport (34) algae (34) water (34) arctic ice (33) concentrating solar power (33) saudi arabia (33) queensland (32) california (31) credit crunch (31) bioplastic (30) offshore wind power (30) population (30) cogeneration (28) geoengineering (28) batteries (26) drought (26) resource wars (26) woodside (26) censorship (25) cleantech (25) bruce sterling (24) ctl (23) limits to growth (23) carbon tax (22) economics (22) exxon (22) lithium (22) buckminster fuller (21) distributed manufacturing (21) iraq oil law (21) coal to liquids (20) indonesia (20) origin energy (20) brightsource (19) rail transport (19) ultracapacitor (19) santos (18) ausra (17) collapse (17) electric bikes (17) michael klare (17) atlantis (16) cellulosic ethanol (16) iceland (16) lithium ion batteries (16) mapping (16) ucg (16) bees (15) concentrating solar thermal power (15) ethanol (15) geodynamics (15) psychology (15) al gore (14) brazil (14) bucky fuller (14) carbon emissions (14) fertiliser (14) matthew simmons (14) ambient energy (13) biodiesel (13) investment (13) kenya (13) public transport (13) big oil (12) biochar (12) chile (12) cities (12) desertec (12) internet of things (12) otec (12) texas (12) victoria (12) antarctica (11) cradle to cradle (11) energy policy (11) hybrid car (11) terra preta (11) tinfoil (11) toyota (11) amory lovins (10) fabber (10) gazprom (10) goldman sachs (10) gtl (10) severn estuary (10) volt (10) afghanistan (9) alaska (9) biomass (9) carbon trading (9) distributed generation (9) esolar (9) four day week (9) fuel cells (9) jeremy leggett (9) methane hydrates (9) pge (9) sweden (9) arrow energy (8) bolivia (8) eroei (8) fish (8) floating offshore wind power (8) guerilla gardening (8) linc energy (8) methane (8) nanosolar (8) natural gas pipelines (8) pentland firth (8) saul griffith (8) stirling engine (8) us elections (8) western australia (8) airborne wind turbines (7) bloom energy (7) boeing (7) chp (7) climategate (7) copenhagen (7) scenario planning (7) vinod khosla (7) apocaphilia (6) ceramic fuel cells (6) cigs (6) futurism (6) jatropha (6) nigeria (6) ocean acidification (6) relocalisation (6) somalia (6) t boone pickens (6) local currencies (5) space based solar power (5) varanus island (5) garbage (4) global energy grid (4) kevin kelly (4) low temperature geothermal power (4) oled (4) tim flannery (4) v2g (4) club of rome (3) norman borlaug (2) peak oil portfolio (1)